Pose2 SLAM
2.1. Pose2 SLAM
A simple way to do Simultaneous Localization and Mapping is to just fuse relative pose measurements between successive robot poses. This landmark-less SLAM variant is often called “Pose SLAM”
%pip -q install gtbook # also installs latest gtsam pre-release
Note: you may need to restart the kernel to use updated packages.
import math

import gtsam
import gtsam.utils.plot as gtsam_plot
import matplotlib.pyplot as plt
PRIOR_NOISE = gtsam.noiseModel.Diagonal.Sigmas(gtsam.Point3(0.3, 0.3, 0.1))
ODOMETRY_NOISE = gtsam.noiseModel.Diagonal.Sigmas(
    gtsam.Point3(0.2, 0.2, 0.1))
Create a factor graph container and add factors to it
graph = gtsam.NonlinearFactorGraph()
2a. Add a prior on the first pose, setting it to the origin
A prior factor consists of a mean and a noise ODOMETRY_NOISE (covariance matrix)
graph.add(gtsam.PriorFactorPose2(1, gtsam.Pose2(0, 0, 0), PRIOR_NOISE))
2b. Add odometry factors Create odometry (Between) factors between consecutive poses
graph.add(gtsam.BetweenFactorPose2(1, 2, gtsam.Pose2(2, 0, 0), ODOMETRY_NOISE))
graph.add(gtsam.BetweenFactorPose2(2, 3, gtsam.Pose2(2, 0, math.pi / 2), ODOMETRY_NOISE))
graph.add(gtsam.BetweenFactorPose2(3, 4, gtsam.Pose2(2, 0, math.pi / 2), ODOMETRY_NOISE))
graph.add(gtsam.BetweenFactorPose2(4, 5, gtsam.Pose2(2, 0, math.pi / 2),ODOMETRY_NOISE))
2c. Add the loop closure constraint This factor encodes the fact that we have returned to the same pose. In real systems, these constraints may be identified in many ways, such as appearance-based techniques with camera images. We will use another Between Factor to enforce this constraint:
graph.add( gtsam.BetweenFactorPose2(5, 2, gtsam.Pose2(2, 0, math.pi / 2), ODOMETRY_NOISE))
print("\nFactor Graph:\n{}".format(graph))
Factor Graph:
NonlinearFactorGraph: size: 6

Factor 0: PriorFactor on 1
  prior mean:  (0, 0, 0)
  noise model: diagonal sigmas [0.3; 0.3; 0.1];

Factor 1: BetweenFactor(1,2)
  measured:  (2, 0, 0)
  noise model: diagonal sigmas [0.2; 0.2; 0.1];

Factor 2: BetweenFactor(2,3)
  measured:  (2, 0, 1.57079633)
  noise model: diagonal sigmas [0.2; 0.2; 0.1];

Factor 3: BetweenFactor(3,4)
  measured:  (2, 0, 1.57079633)
  noise model: diagonal sigmas [0.2; 0.2; 0.1];

Factor 4: BetweenFactor(4,5)
  measured:  (2, 0, 1.57079633)
  noise model: diagonal sigmas [0.2; 0.2; 0.1];

Factor 5: BetweenFactor(5,2)
  measured:  (2, 0, 1.57079633)
  noise model: diagonal sigmas [0.2; 0.2; 0.1];
Create the data structure to hold the initial_estimate estimate to the solution. For illustrative purposes, these have been deliberately set to incorrect values
initial_estimate = gtsam.Values()
initial_estimate.insert(1, gtsam.Pose2(0.5, 0.0, 0.2))
initial_estimate.insert(2, gtsam.Pose2(2.3, 0.1, -0.2))
initial_estimate.insert(3, gtsam.Pose2(4.1, 0.1, math.pi / 2))
initial_estimate.insert(4, gtsam.Pose2(4.0, 2.0, math.pi))
initial_estimate.insert(5, gtsam.Pose2(2.1, 2.1, -math.pi / 2))
print("\nInitial Estimate:\n{}".format(initial_estimate))
Initial Estimate:
Values with 5 values:
Value 1: (gtsam::Pose2)
(0.5, 0, 0.2)

Value 2: (gtsam::Pose2)
(2.3, 0.1, -0.2)

Value 3: (gtsam::Pose2)
(4.1, 0.1, 1.57079633)

Value 4: (gtsam::Pose2)
(4, 2, 3.14159265)

Value 5: (gtsam::Pose2)
(2.1, 2.1, -1.57079633)
Optimize the initial values using a Gauss-Newton nonlinear optimizer The optimizer accepts an optional set of configuration parameters, controlling things like convergence criteria, the type of linear system solver to use, and the amount of information displayed during optimization. We will set a few parameters as a demonstration.
parameters = gtsam.GaussNewtonParams()
Stop iterating once the change in error between steps is less than this value
parameters.setRelativeErrorTol(1e-5)
Do not perform more than N iteration steps
parameters.setMaxIterations(100)
Create the optimizer …
optimizer = gtsam.GaussNewtonOptimizer(graph, initial_estimate, parameters)
… and optimize
result = optimizer.optimize()
print("Final Result:\n{}".format(result))
Final Result:
Values with 5 values:
Value 1: (gtsam::Pose2)
(-2.7684295e-20, -8.15199774e-20, -3.57721281e-20)

Value 2: (gtsam::Pose2)
(2, -1.89295335e-19, -5.34287057e-20)

Value 3: (gtsam::Pose2)
(4, -3.42174082e-11, 1.57079633)

Value 4: (gtsam::Pose2)
(4, 2, 3.14159265)

Value 5: (gtsam::Pose2)
(2, 2, -1.57079633)
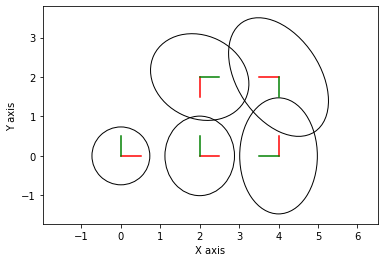
Calculate and print marginal covariances for all variables
marginals = gtsam.Marginals(graph, result)
for i in range(1, 6):
    print("X{} covariance:\n{}\n".format(i, marginals.marginalCovariance(i)))
X1 covariance:
[[ 9.00000000e-02 -2.12500911e-18 -7.19466295e-18]
 [-2.12500911e-18  9.00000000e-02 -5.75539616e-17]
 [-7.19466295e-18 -5.75539616e-17  1.00000000e-02]]

X2 covariance:
[[ 1.30000000e-01 -2.52182245e-17 -2.01024710e-17]
 [-2.52182245e-17  1.70000000e-01  2.00000000e-02]
 [-2.01024710e-17  2.00000000e-02  2.00000000e-02]]

X3 covariance:
[[ 3.62000000e-01 -3.29296371e-12  6.20000000e-02]
 [-3.29296189e-12  1.62000000e-01 -2.00000000e-03]
 [ 6.20000000e-02 -2.00000000e-03  2.65000000e-02]]

X4 covariance:
[[ 0.268 -0.128  0.048]
 [-0.128  0.378 -0.068]
 [ 0.048 -0.068  0.028]]

X5 covariance:
[[ 0.202   0.036  -0.018 ]
 [ 0.036   0.26   -0.051 ]
 [-0.018  -0.051   0.0265]]
for i in range(1, 6):
    gtsam_plot.plot_pose2(0, result.atPose2(i), 0.5,
                            marginals.marginalCovariance(i))

plt.axis('equal')
plt.show()

